RSS

Calgary Market Statistics January 2025.

Supply levels improve in January. Following three consecutive years of limited supply choice, inventory levels in January rose to 3,639 units. While the 70 per cent year-over-year gain is significant, inventory levels remain lower than the over 4,000 units we would typically see in January. Inventories rose across all property types, with some of the largest gains driven by apartment-style condominiums.

“Supply levels are expected to improve this year, contributing to more balanced conditions and slower price growth,” said Ann-Marie Lurie, Chief Economist at CREB®. “However, the adjustment in supply is not equal amongst all property types. Compared with sales, we continue to see persistently tight conditions for detached, semi-detached and row properties while apartment condominiums show signs of excess supply for higher priced units.”

Citywide, the months of supply reached 2.5 months in January, an improvement over the one month of supply reported last year, but it is still considered low for a winter month. The month of supply ranged from under two months for semi-detached properties to 3.5 months for apartment-style units.

Rising supply resulted from a boost in new listings compared to sales. New listings rose to 2,896 units in January, compared to 1,451 sales. Sales in January were down by 12 per cent compared to last year. However, even with a pullback in sales, levels remained nearly 30 per cent higher than levels typically recorded in January. 

The total residential benchmark price in January was $583,000, which is relatively stable compared to levels reported at the end of last year and nearly three per cent higher than last January. Price growth ranged across districts within the city as well as property types. 

Read

Okotoks Market Stats January 2025.

New listings in Okotoks remained relatively low compared to last year. While the pullback in sales did help support some improvements in inventory levels, the 68 units available in January are still half the levels that were available prior to the pandemic. Limited supply has driven up much of the price gains in this market since 2021. As of January, the unadjusted benchmark price was $614, 900, a slight gain over last month and nearly 5 percent higher than last year. (Data source CREB).

Read

August 2024 Market Statistics.

Here are the market statistics for Aug 2024. Please don’t ever hesitate to call me if you ever have any questions on the market in your area.

Want to know what you neighbour sold for? Click Here if you would like a market report for your community (or the community you would like to move to) sent straight to your inbox every month!

Read

June 2024 Market Statistics.

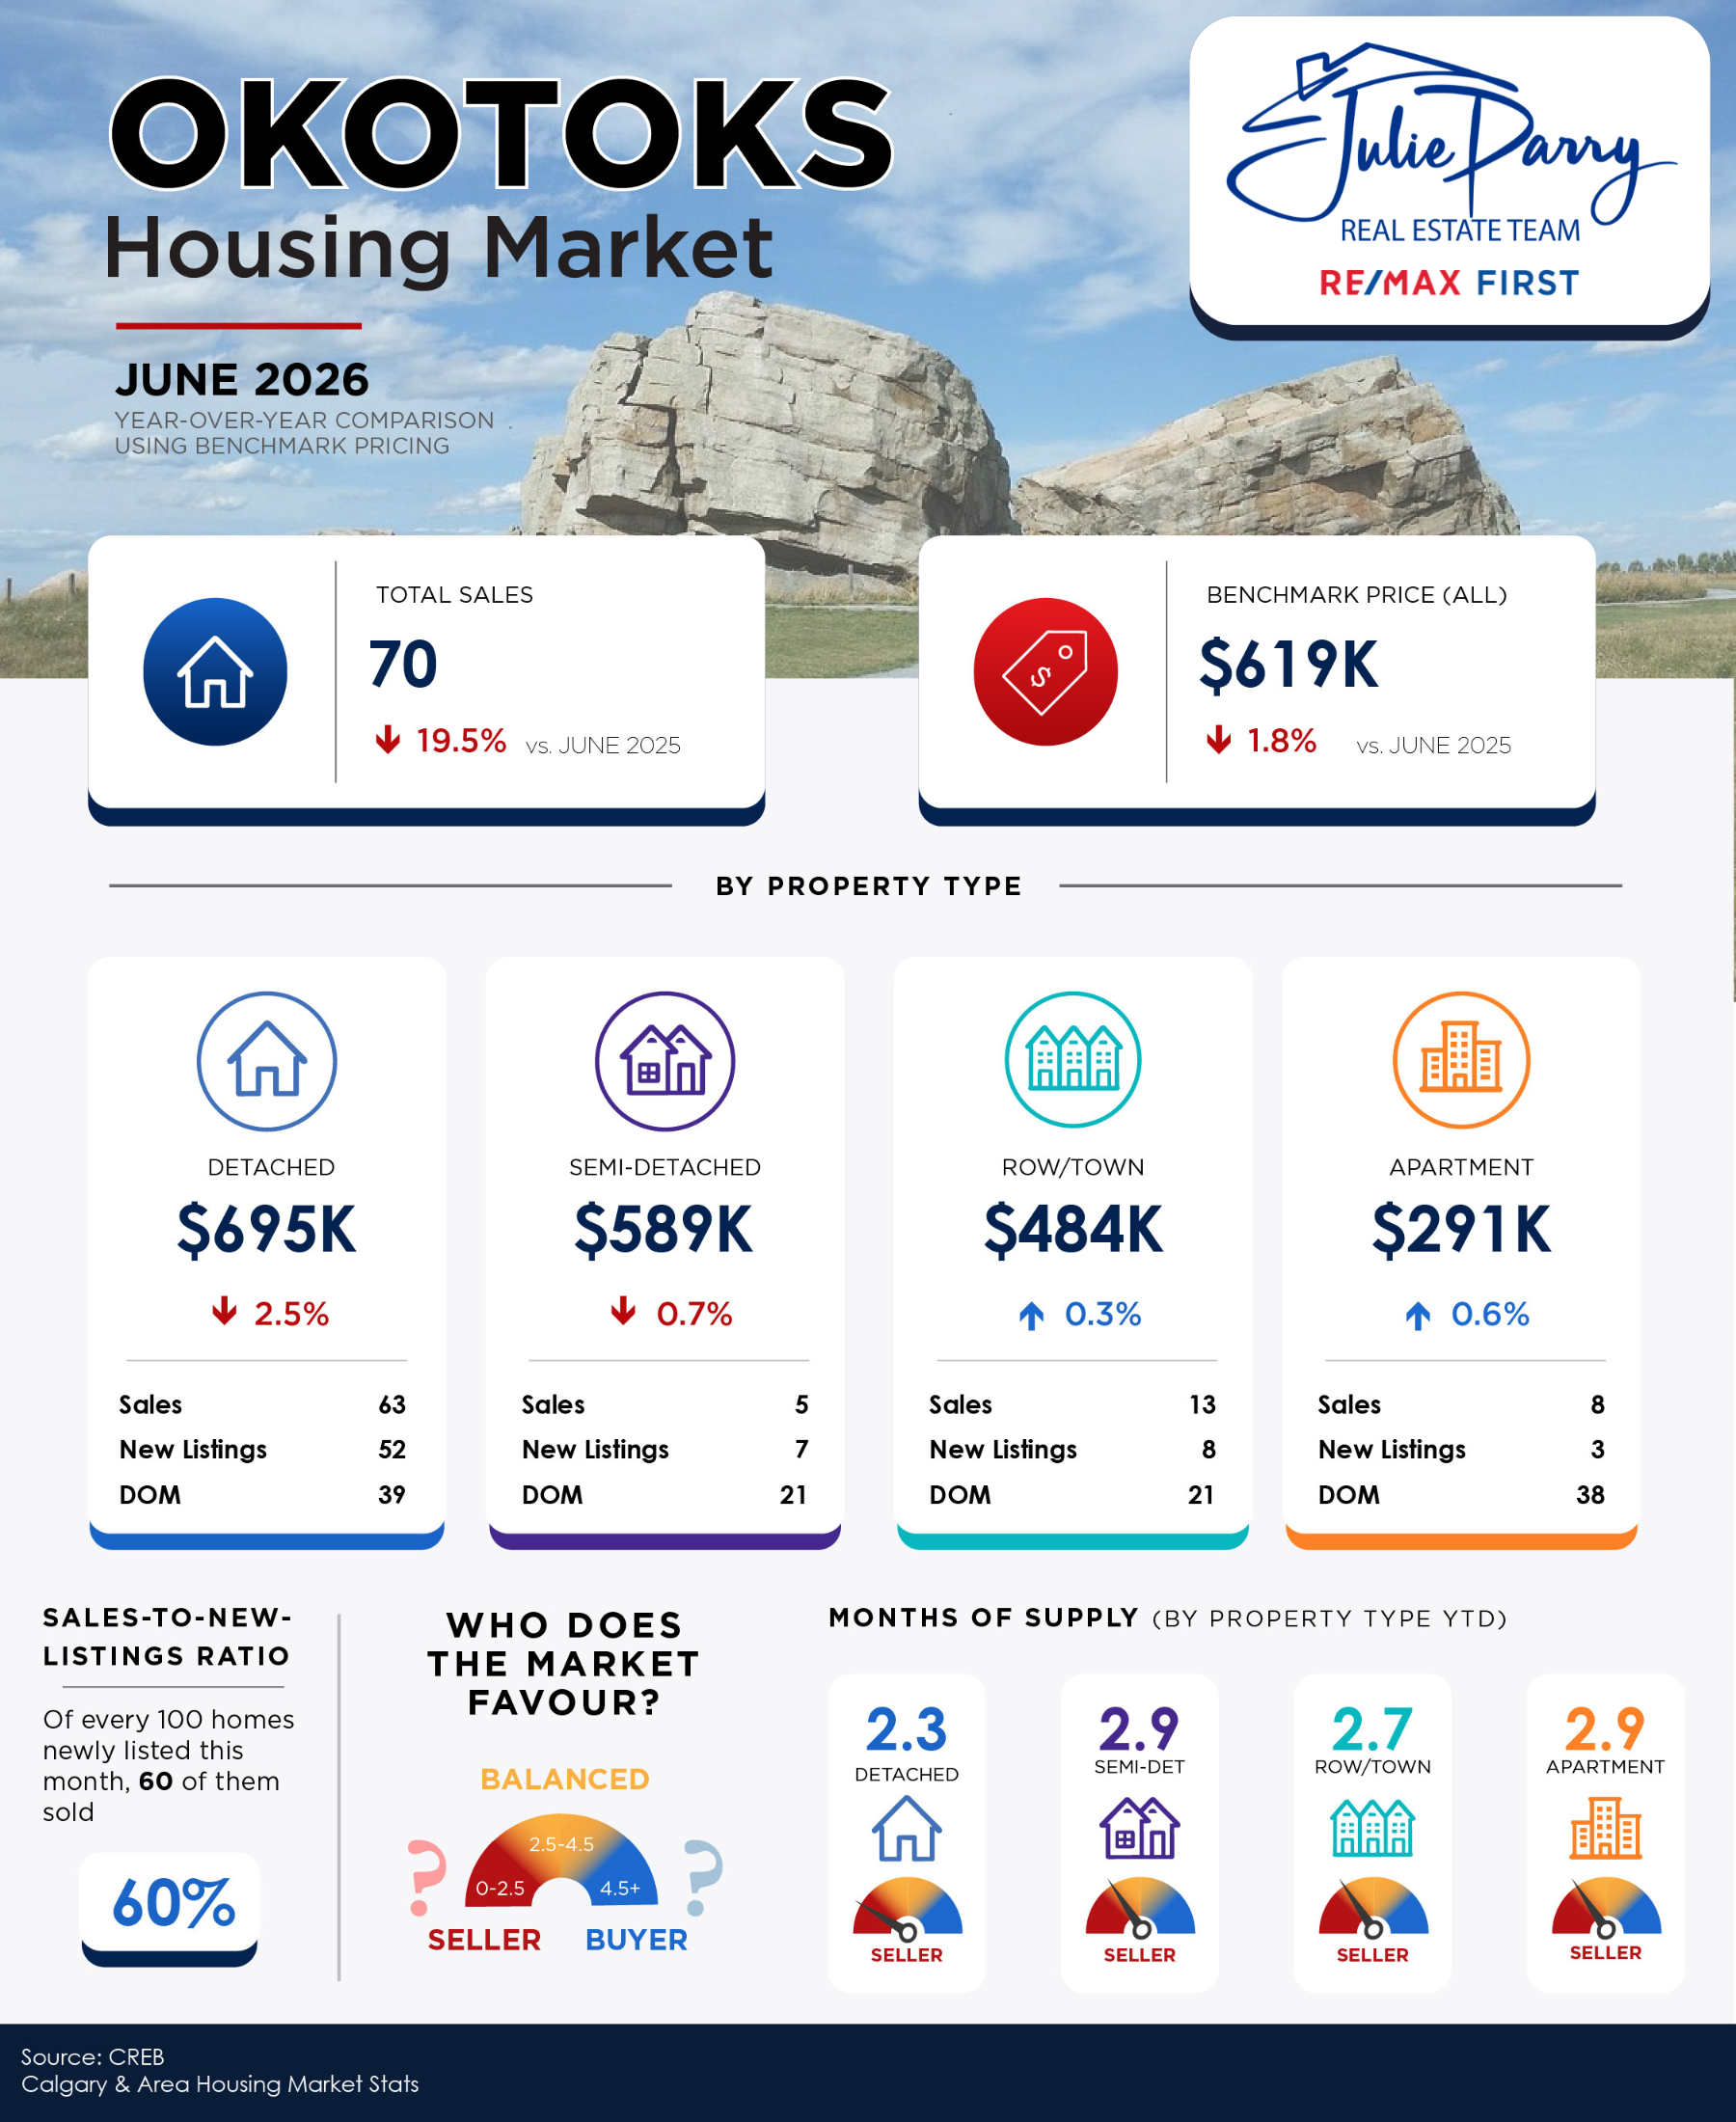
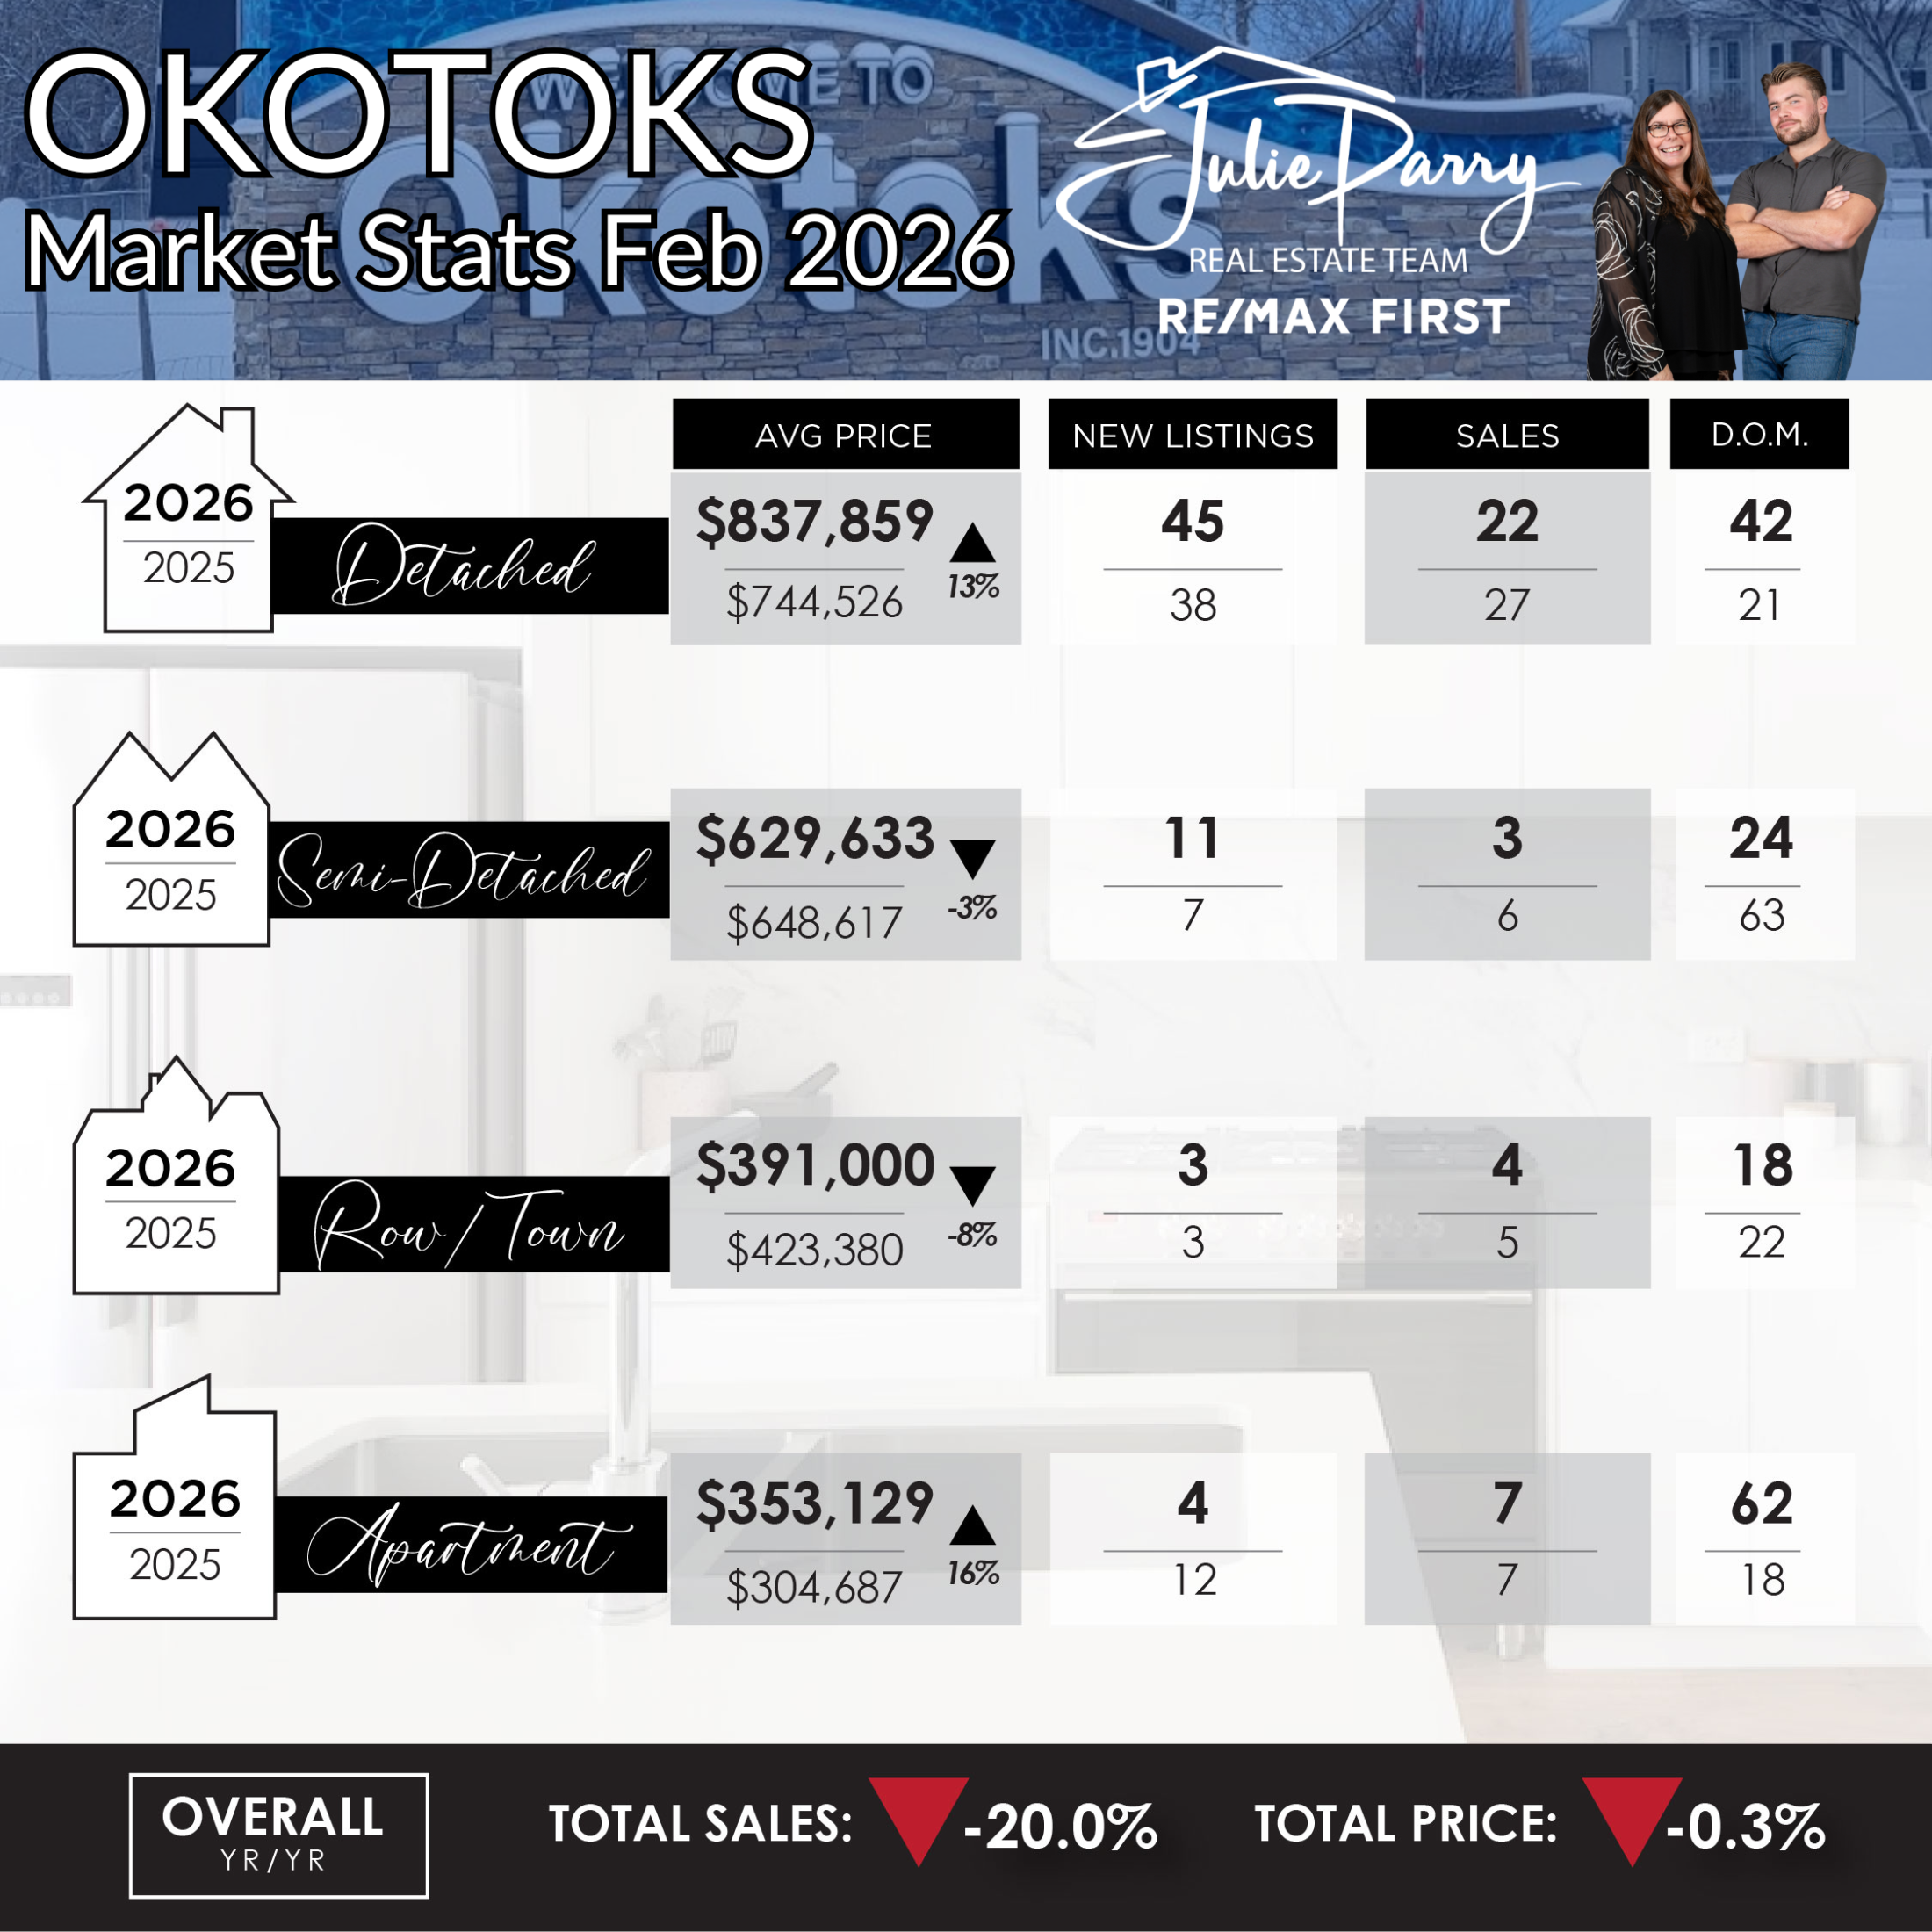
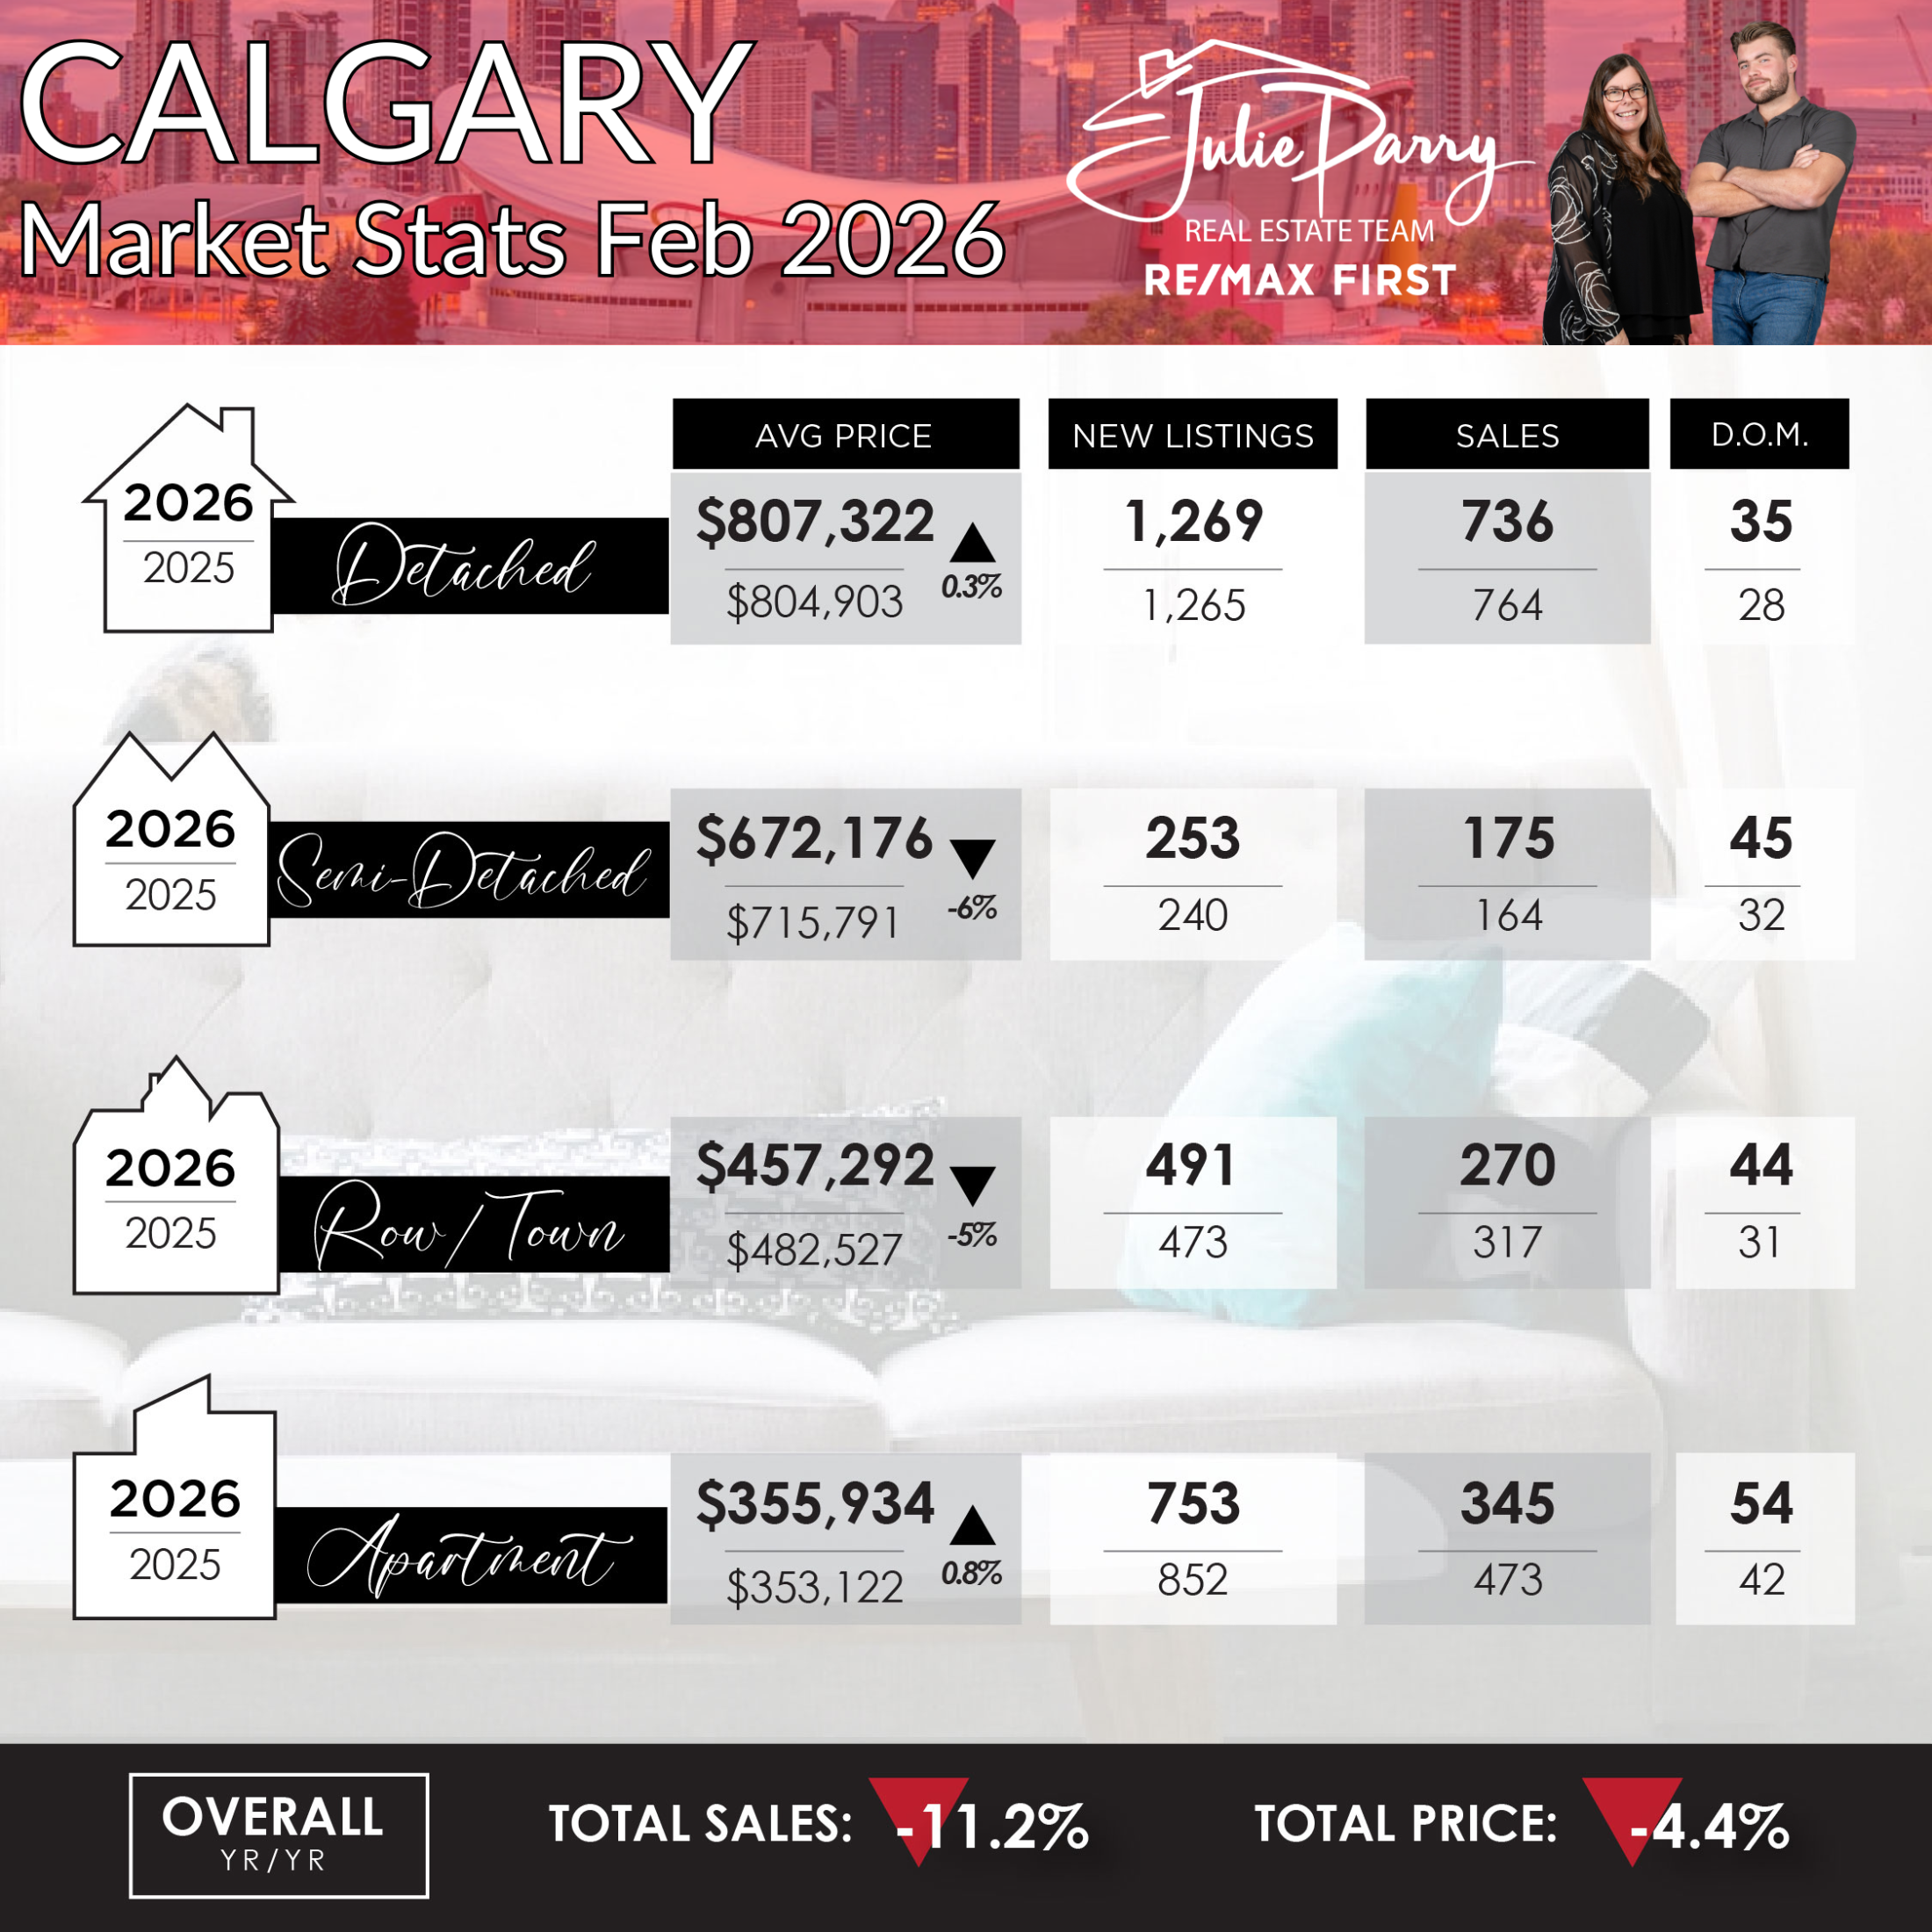
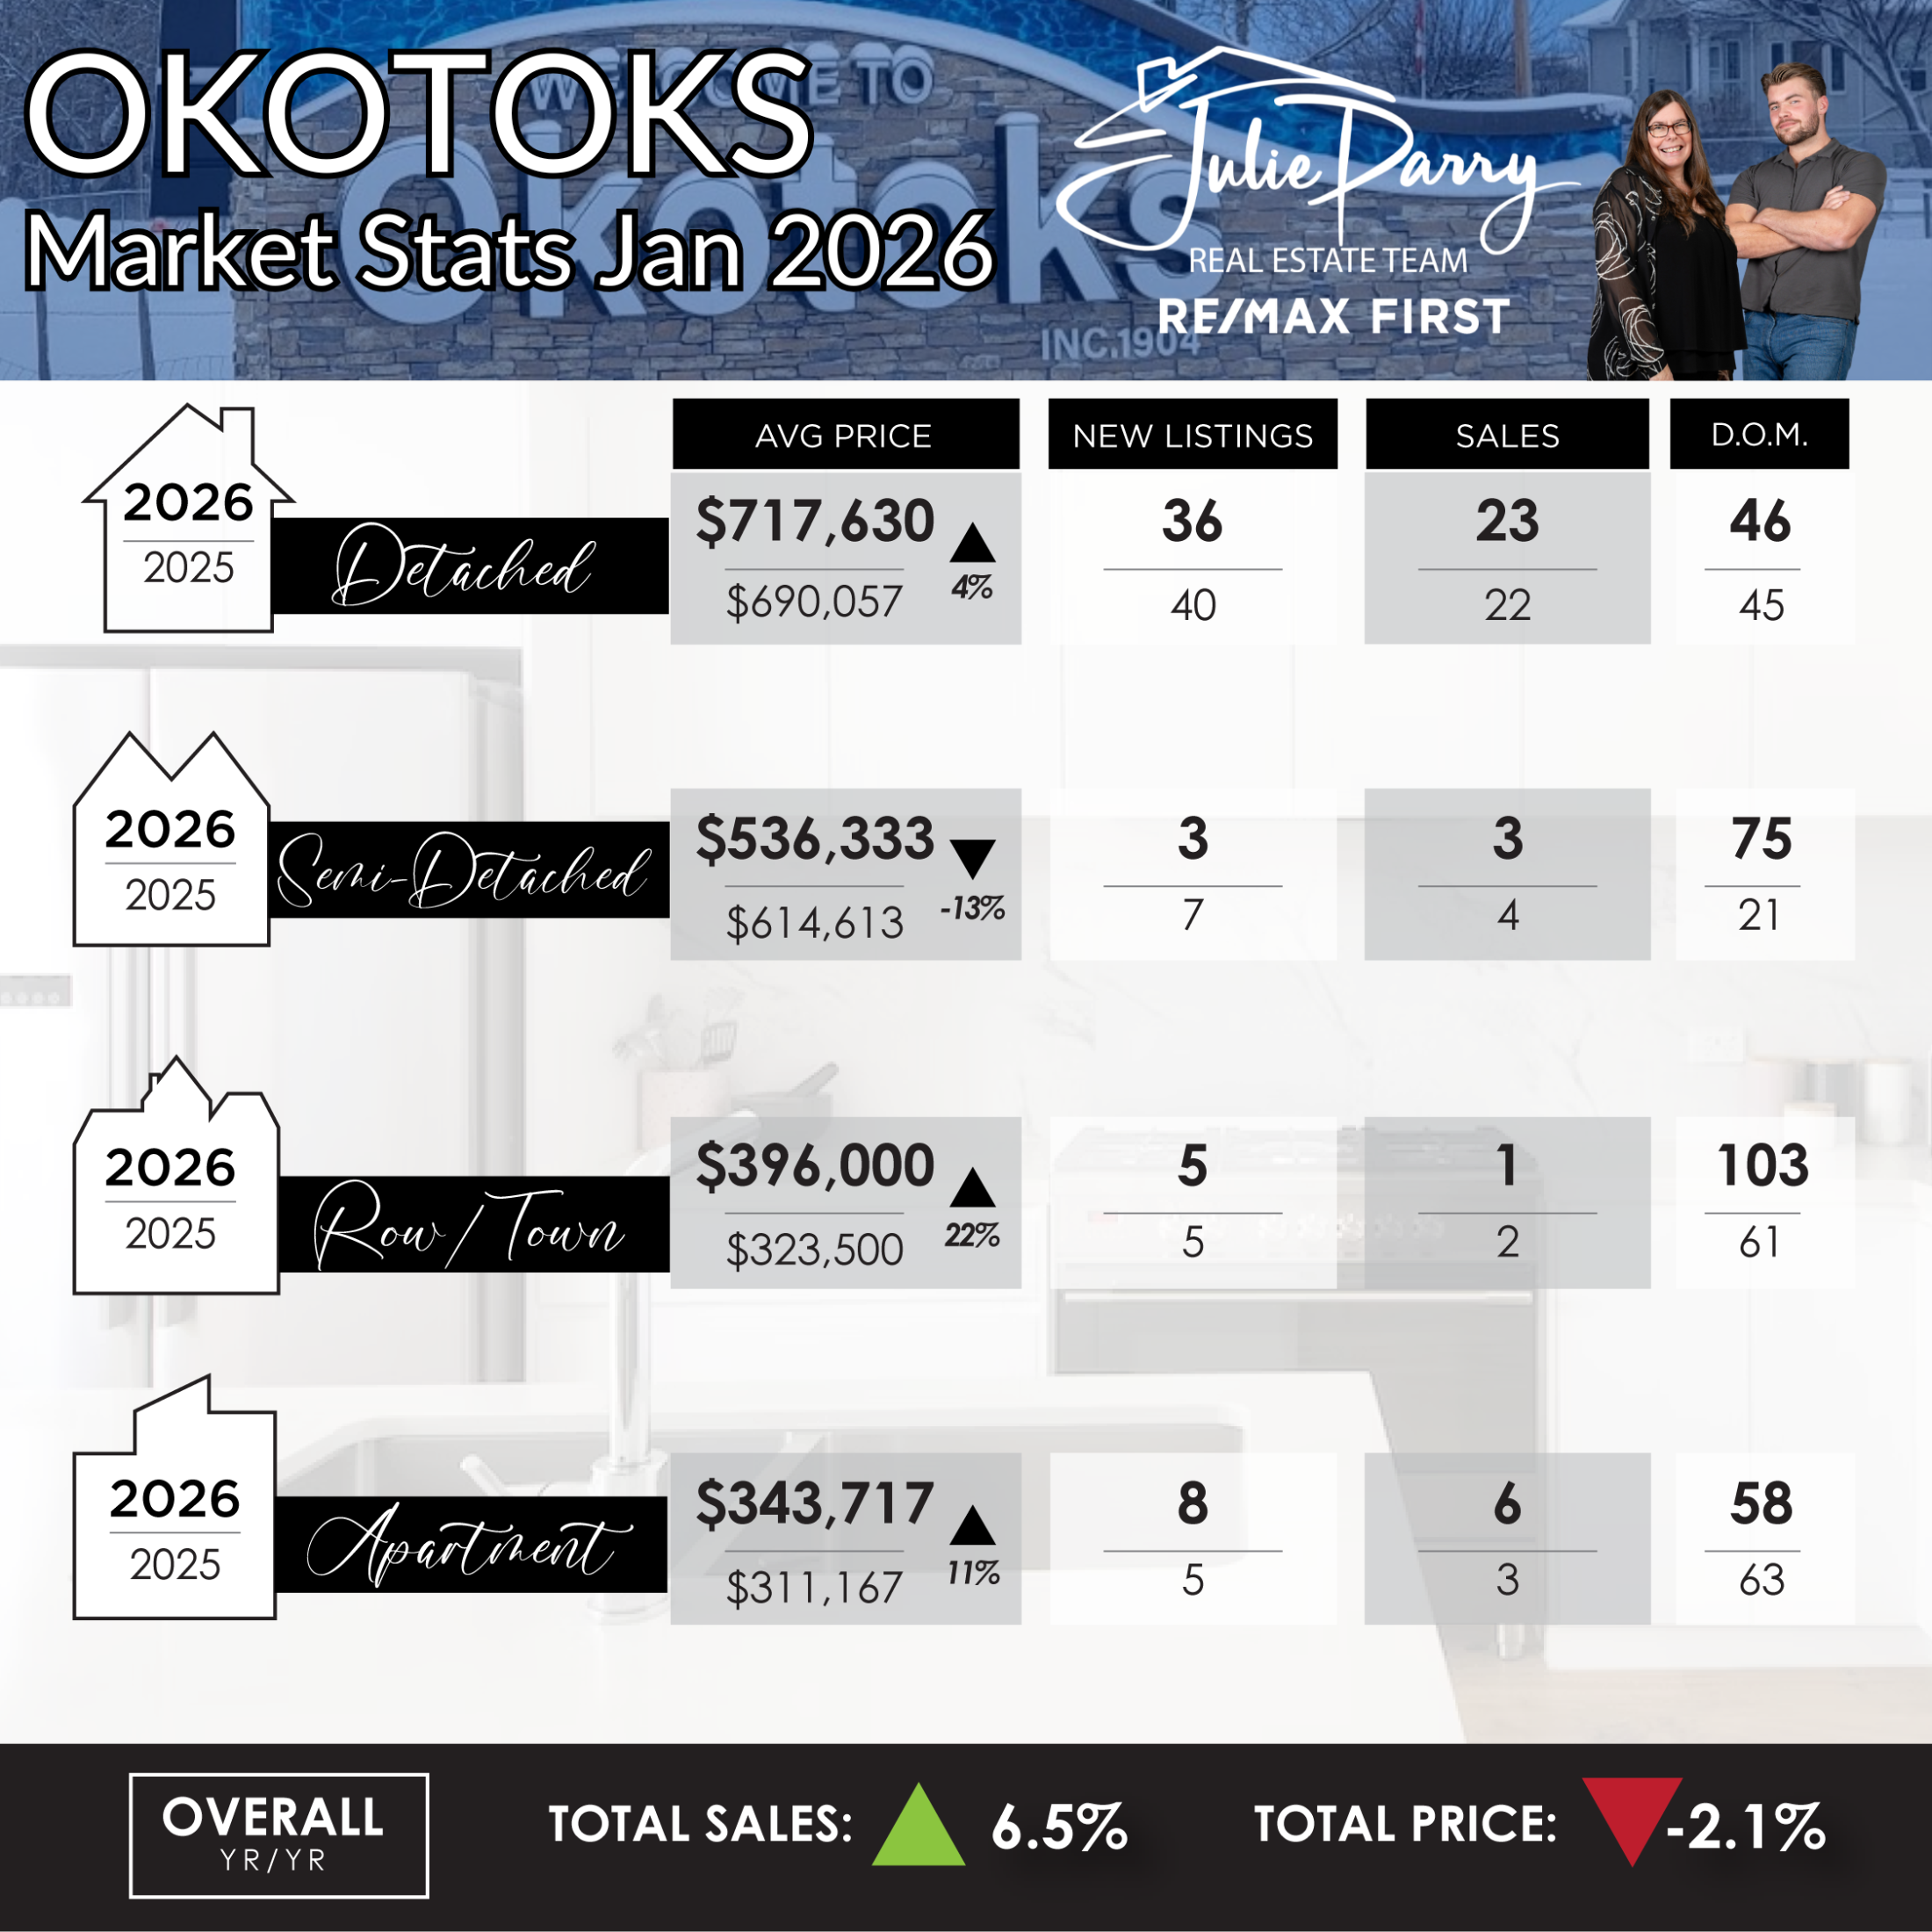
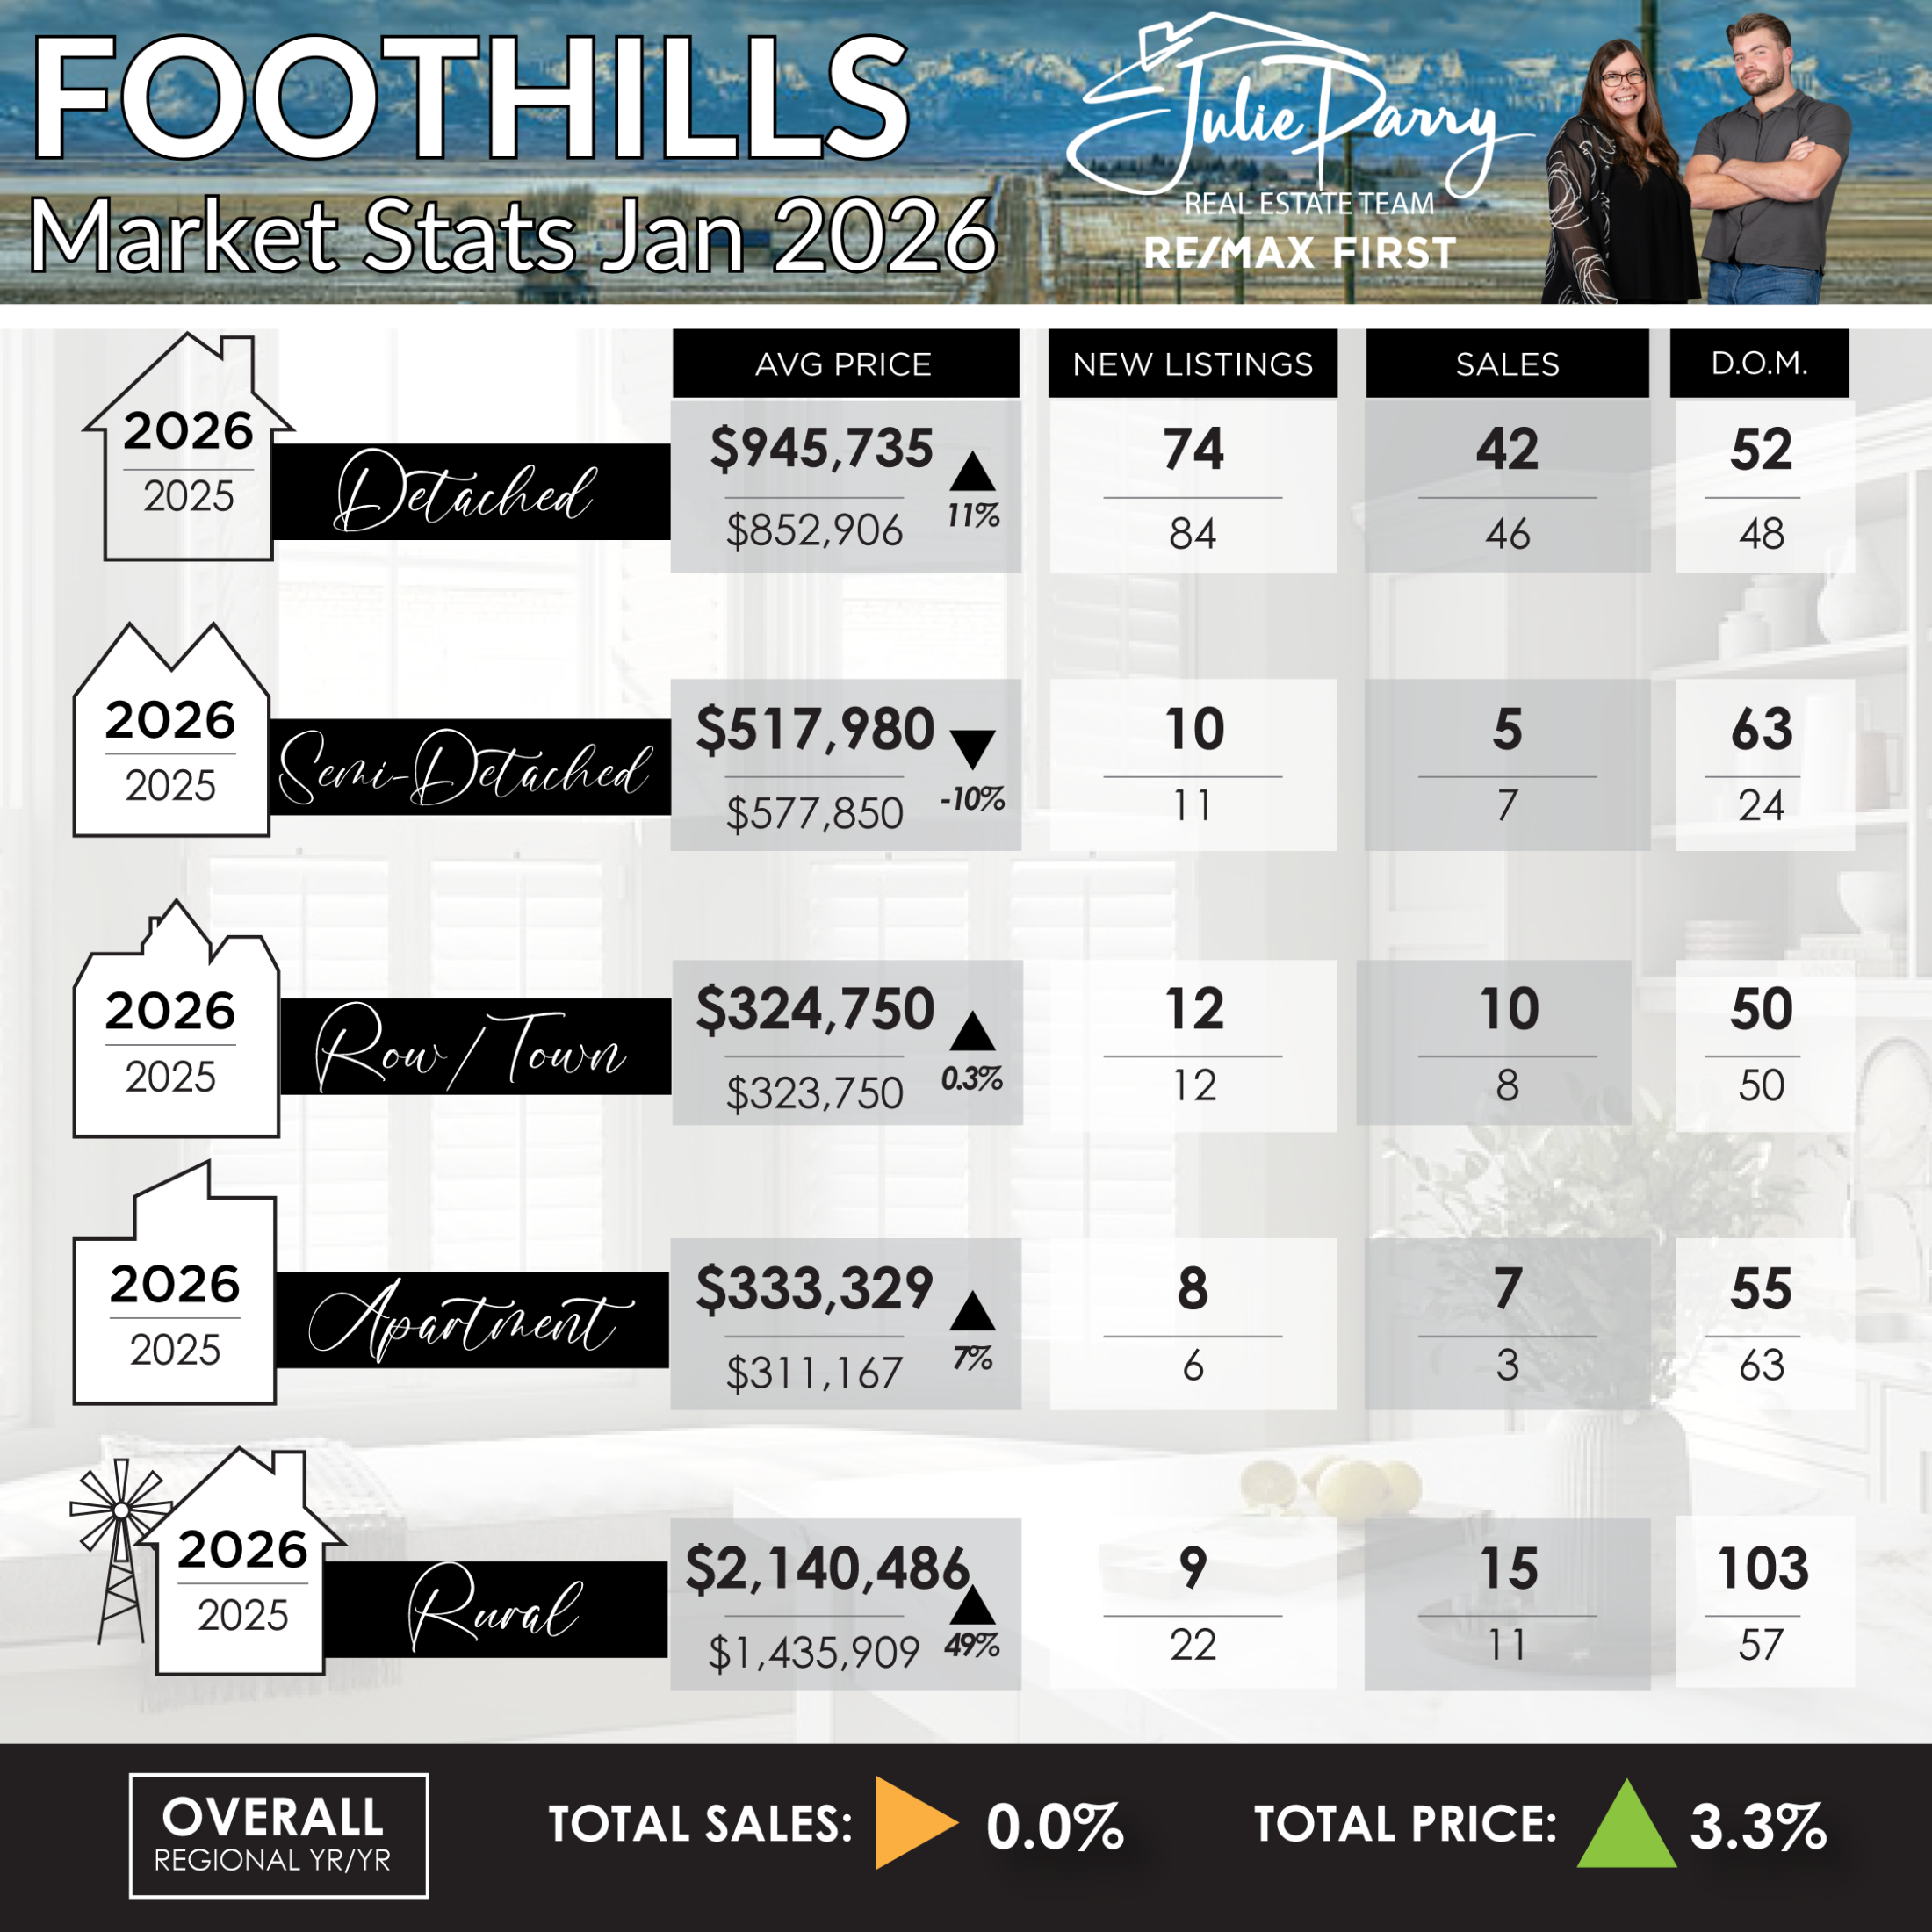
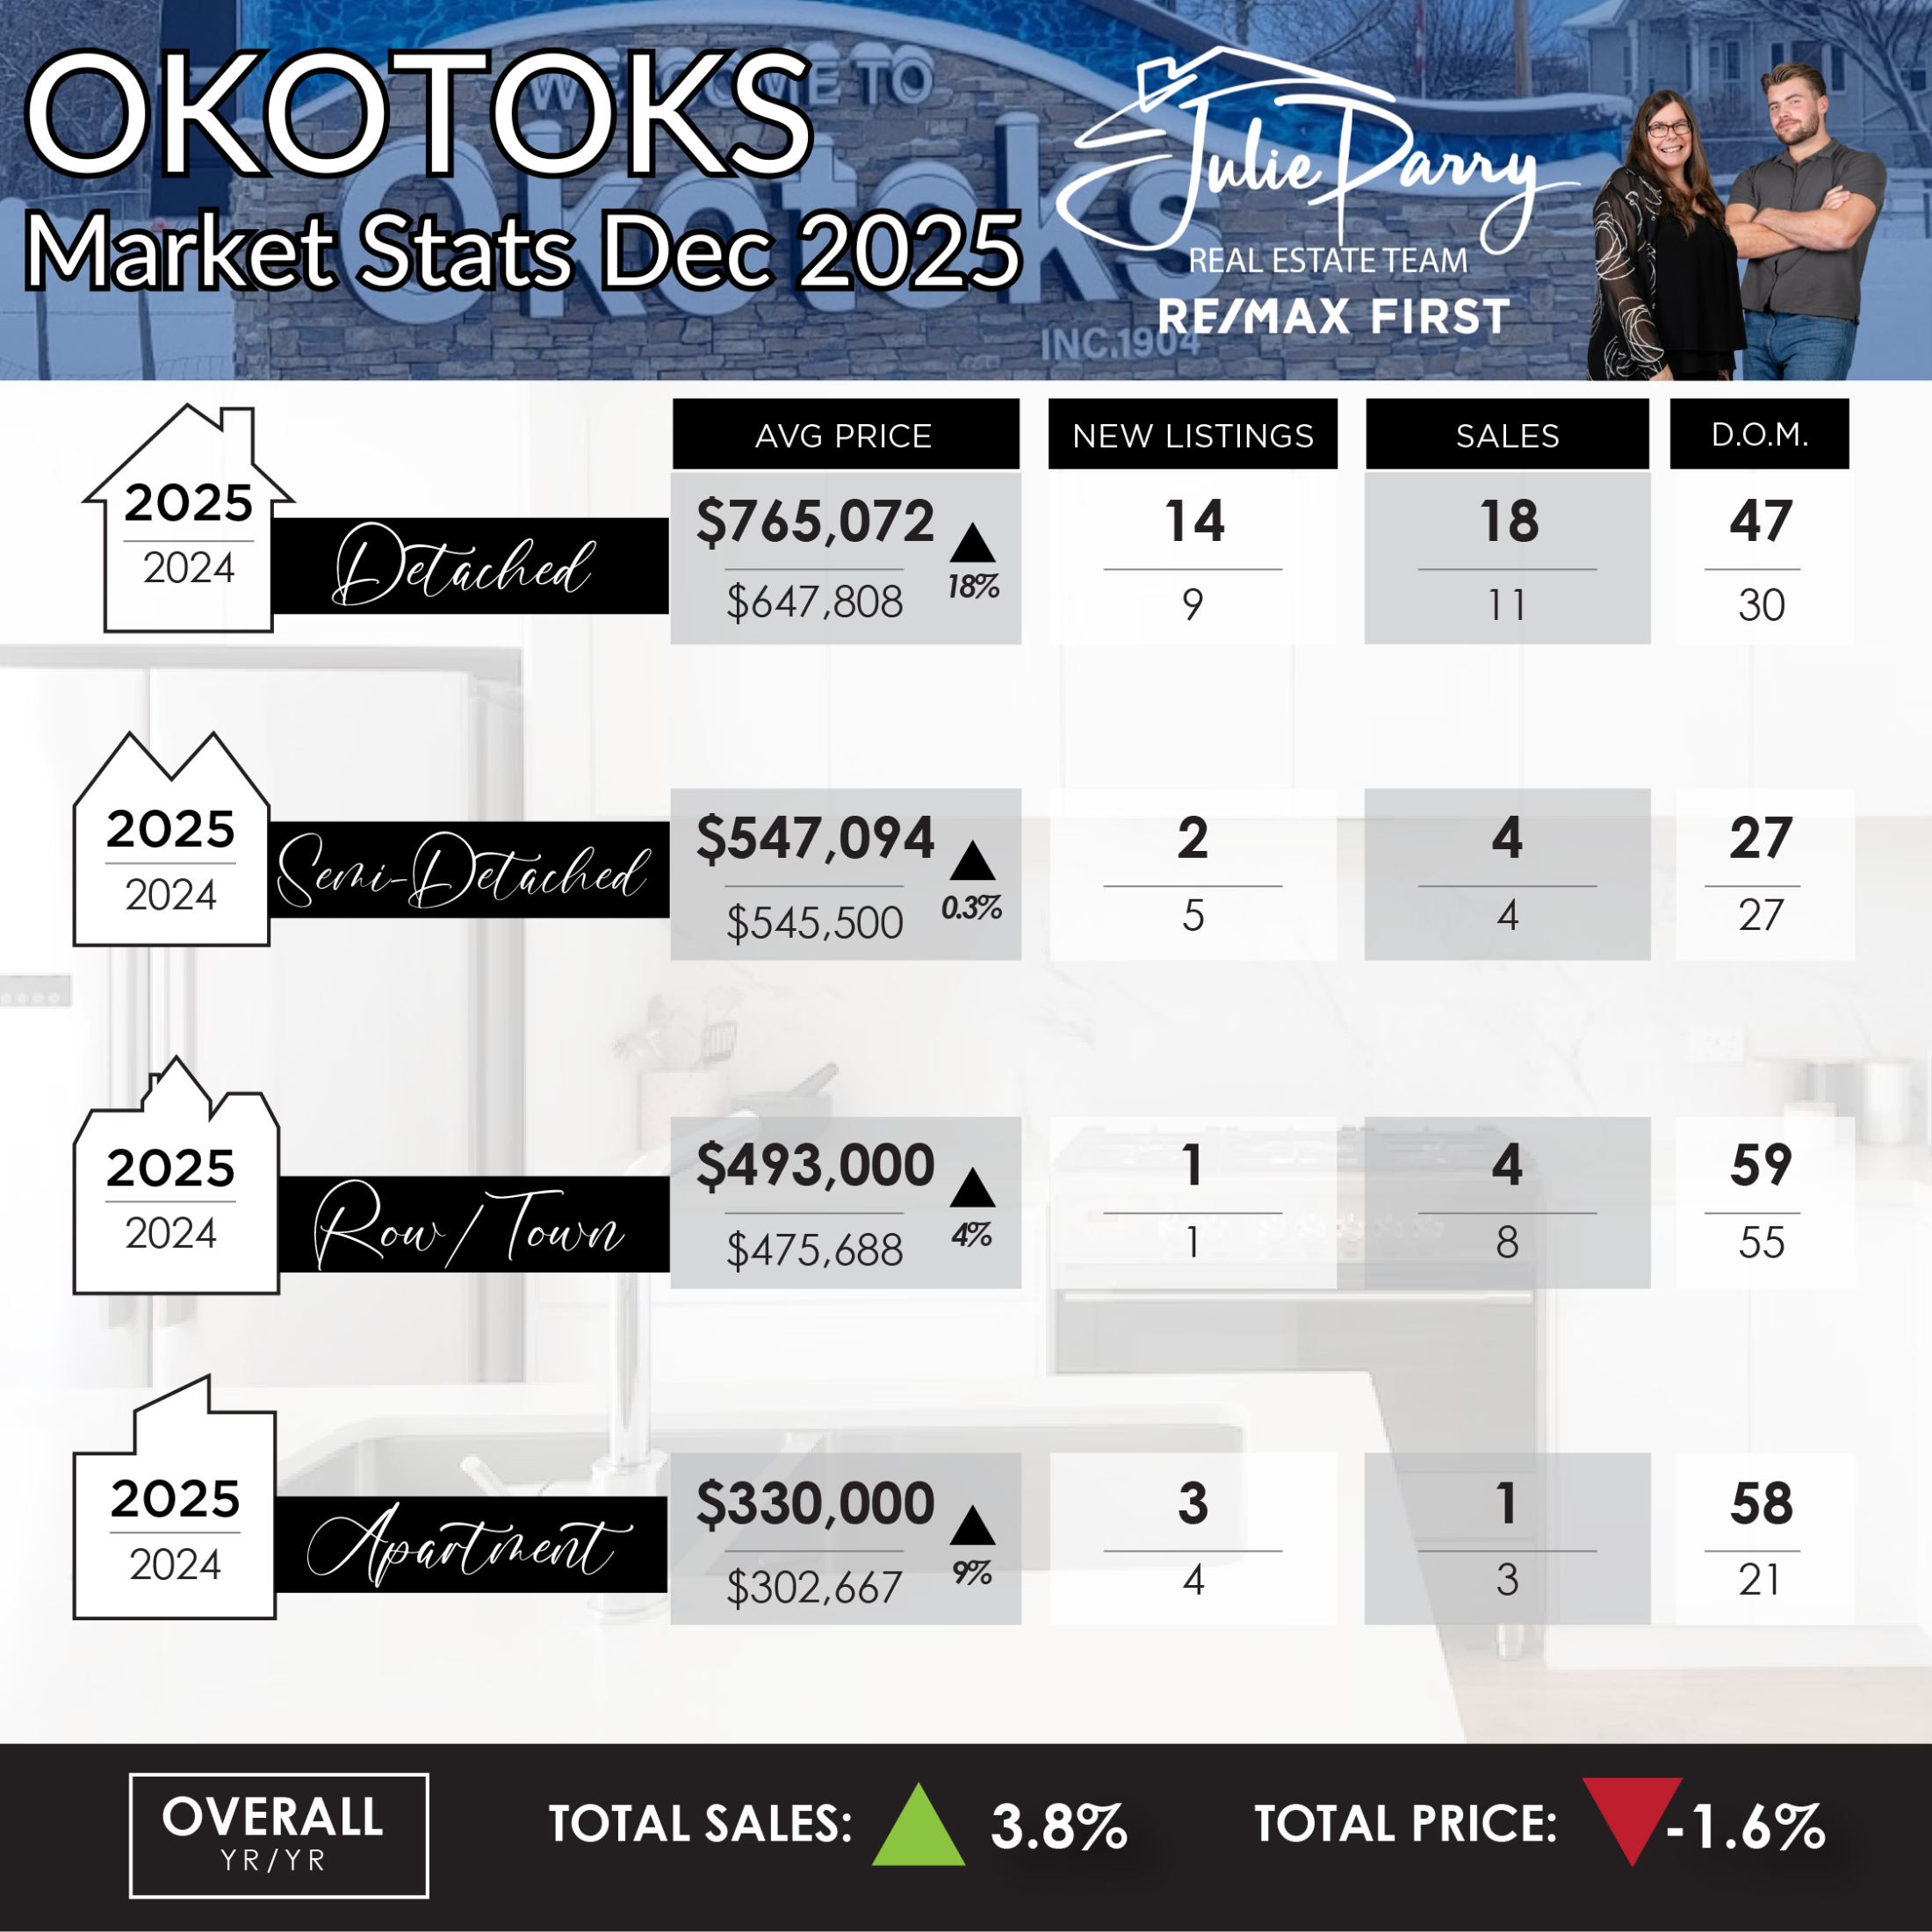
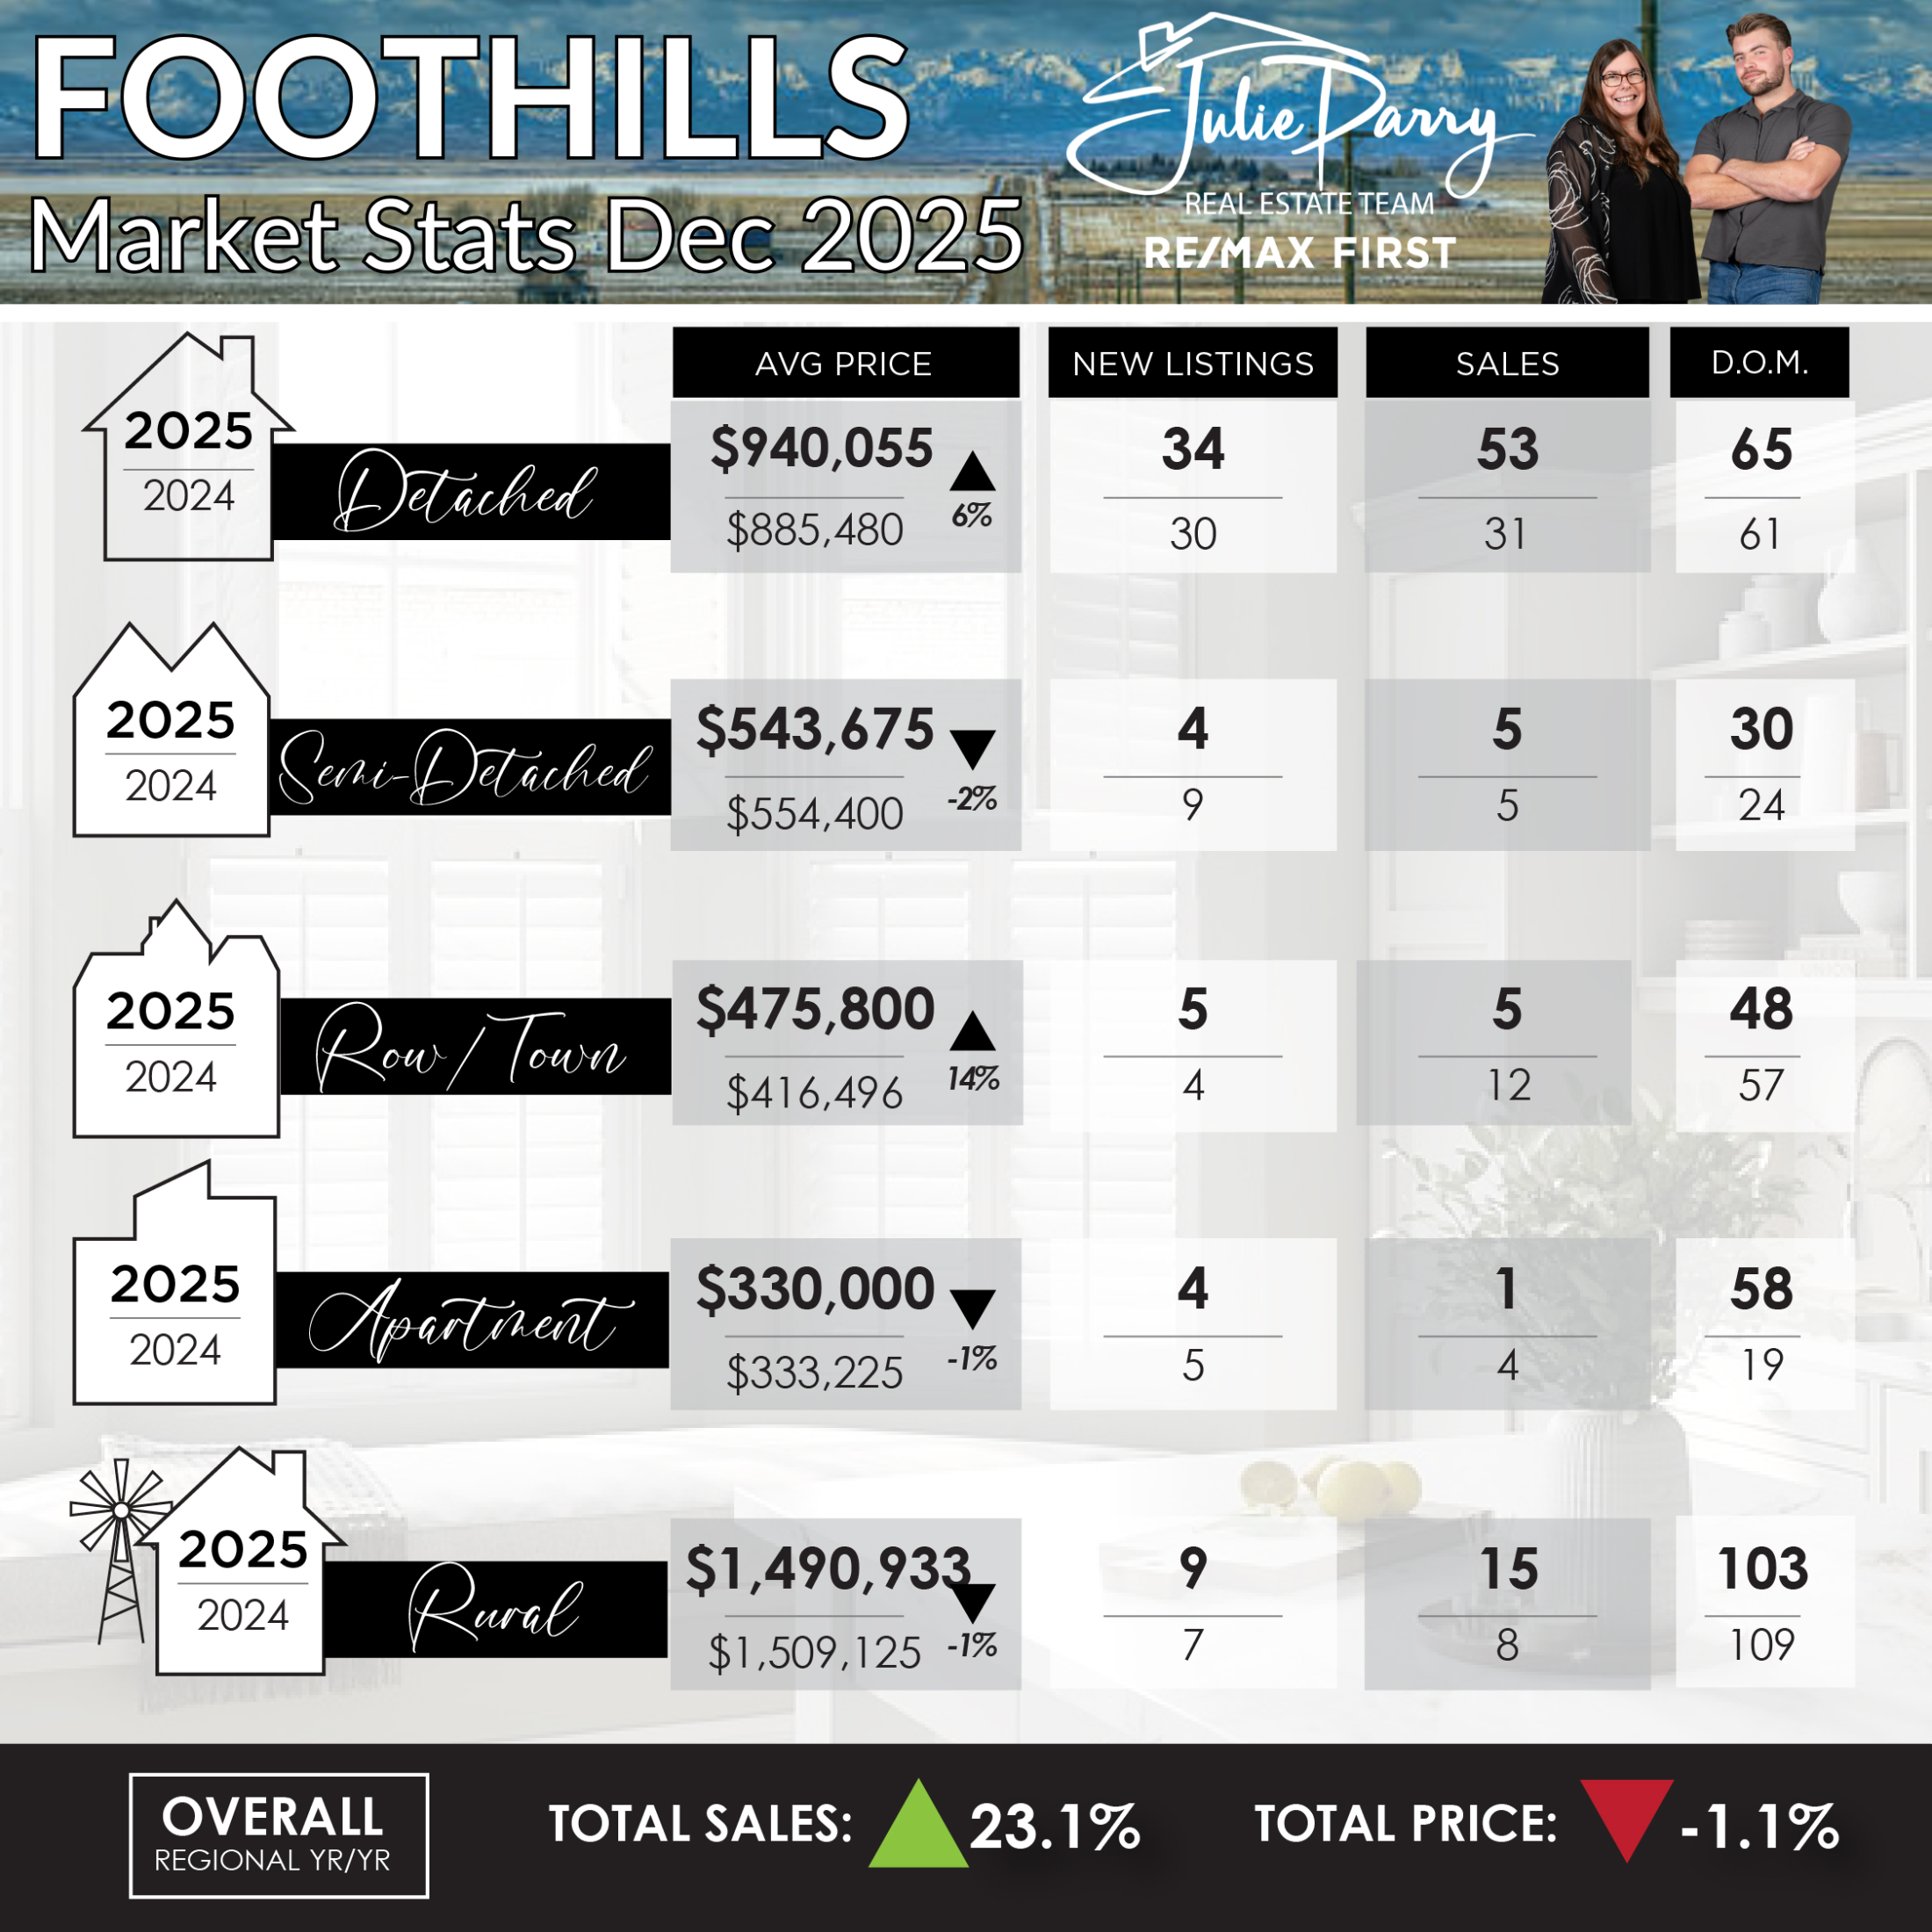
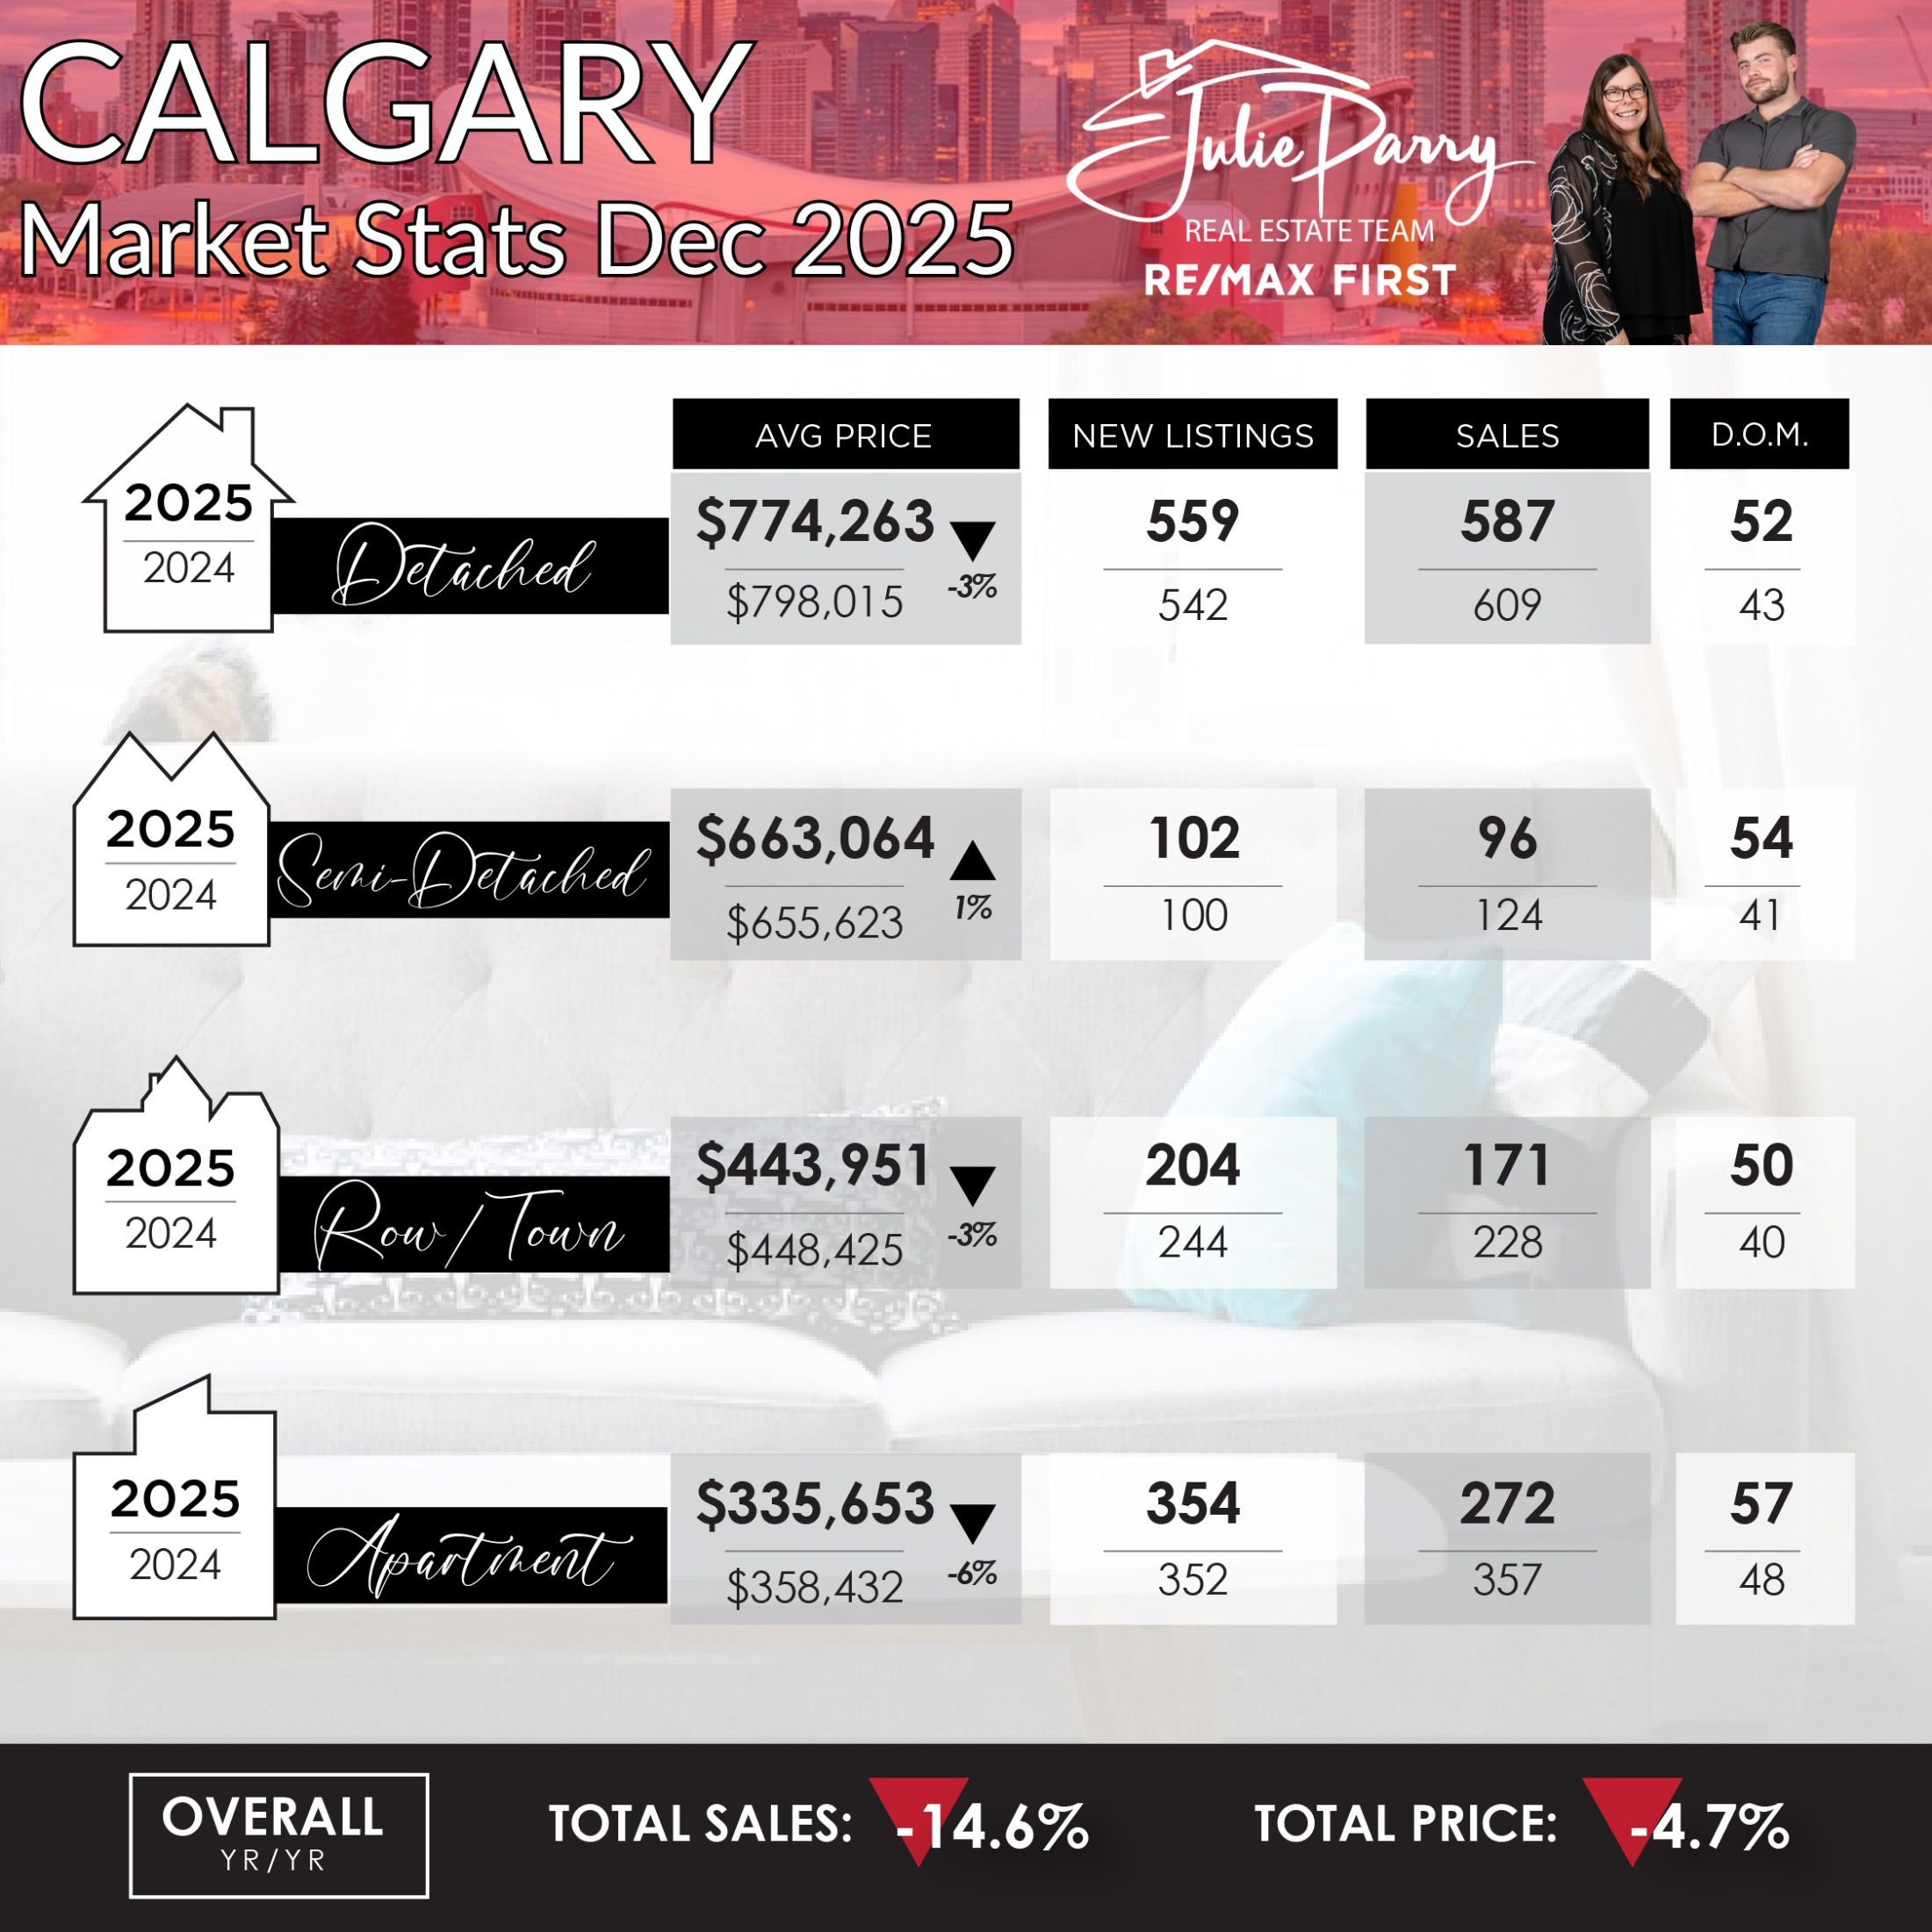
Here are the market statistics for June 2024. Please don’t ever hesitate to call me if you ever have any questions on the market in your area.

Want to know what you neighbour sold for? Click Here if you would like a market report for your community (or the community you would like to move to) sent straight to your inbox every month!

Read

May 2024 Market Statistics.

Here are the market statistics for May 2024. Please don’t ever hesitate to call me if you ever have any questions on the market in your area.

Want to know what you neighbour sold for? Click Here if you would like a market report for your community (or the community you would like to move to) sent straight to your inbox every month!

Read

April 2024 Market Statistics.

Here are the market statistics for April 2024. Please don’t ever hesitate to call me if you ever have any questions on the market in your area.

Want to know what you neighbour sold for? Click Here if you would like a market report for your community (or the community you would like to move to) sent straight to your inbox every month!

Read

March 2024 Market Statistics.

CITY OF CALGARY, APR 1 2024

“We have not seen March conditions this tight since 2006, which was the last time we reported high levels of interprovincial migration and a months-of-supply below one month,” said Ann-Marie Lurie, Chief Economist at CREB. “Moreover, we are entering a third consecutive year of a market favoring the seller as the as the two year spike in migration has driven up demand and contributed to the drop in re-sale and rental supply. Given supply adjustments take time, it is not a surprise that we continue to see upward pressure on home prices.

SOURCE: CREB.  

Here are the market statistics for February 2024. Please don’t ever hesitate to call me if you ever have any questions on the market in your area.

Want to know what your neighbour sold for? Click Here if you would like a market report for your community (or the community you would like to move to) sent straight to your inbox every month!

Read

February 2024 Market Statistics.

Here are the market statistics for February 2024. Please don’t ever hesitate to call me if you ever have any questions on the market in your area.

Want to know what your neighbour sold for? Click Here if you would like a market report for your community (or the community you would like to move to) sent straight to your inbox every month!

Read

January 2024 Market Statistics.

Here are the market statistics for January 2024. Please don’t ever hesitate to call me if you ever have any questions on the market in your area.

Want to know what your neighbour sold for? Click Here if you would like a market report for your community (or the community you would like to move to) sent straight to your inbox every month!

Read
Data is supplied by Pillar 9™ MLS® System. Pillar 9™ is the owner of the copyright in its MLS®System. Data is deemed reliable but is not guaranteed accurate by Pillar 9™.
The trademarks MLS®, Multiple Listing Service® and the associated logos are owned by The Canadian Real Estate Association (CREA) and identify the quality of services provided by real estate professionals who are members of CREA. Used under license.